Speed Bands: Adding Color — And Context — to Your Trip Maps
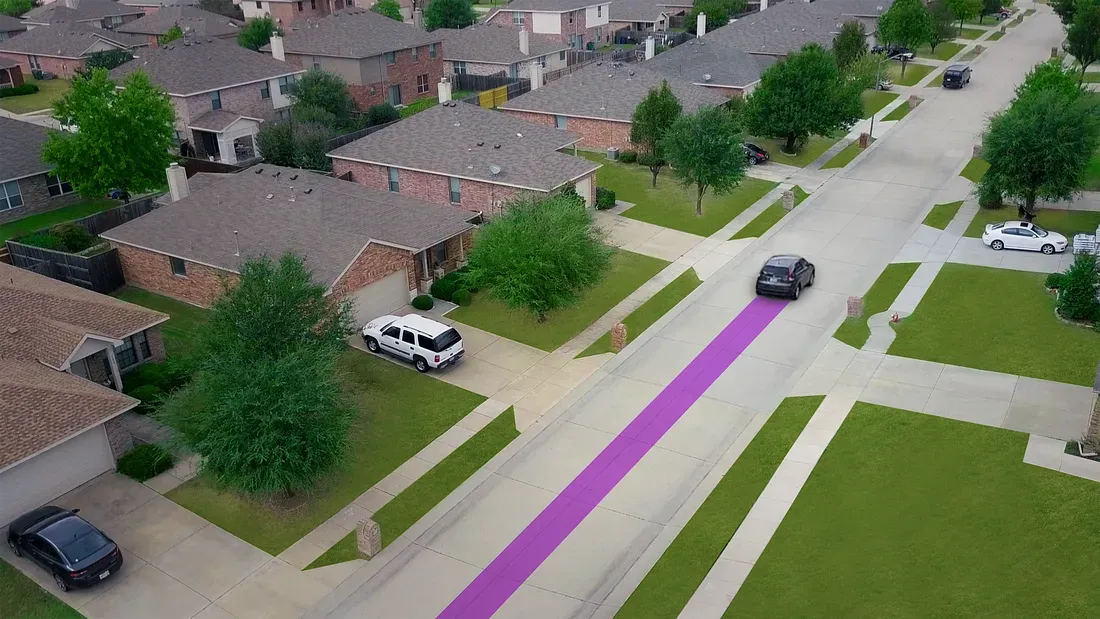
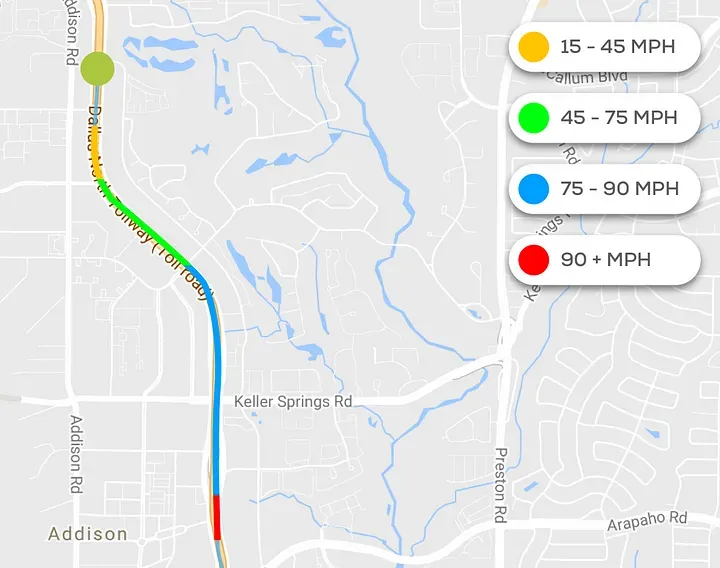
Bouncie is excited to announce the release of Speed Bands, a new feature that allows you to assign colors to customized speed ranges. The colors display on the trip map and show how fast a vehicle was traveling through a particular section of a trip. For example, you can set the Speed Bands to display yellow on the map where a vehicle drove between 15–45 MPH and in green for where it traveled at 45–75 MPH.
Adding Speed Bands to your trip maps can help make you a smarter and safer driver by not only displaying vehicle speed but also giving you context behind hard braking or speed alerts.
Additionally, if you change the Speed Bands, you can review past trips and examine the speeds based on the adjusted settings.
View Actual Speeds Traveled on Every Trip with Speed Bands
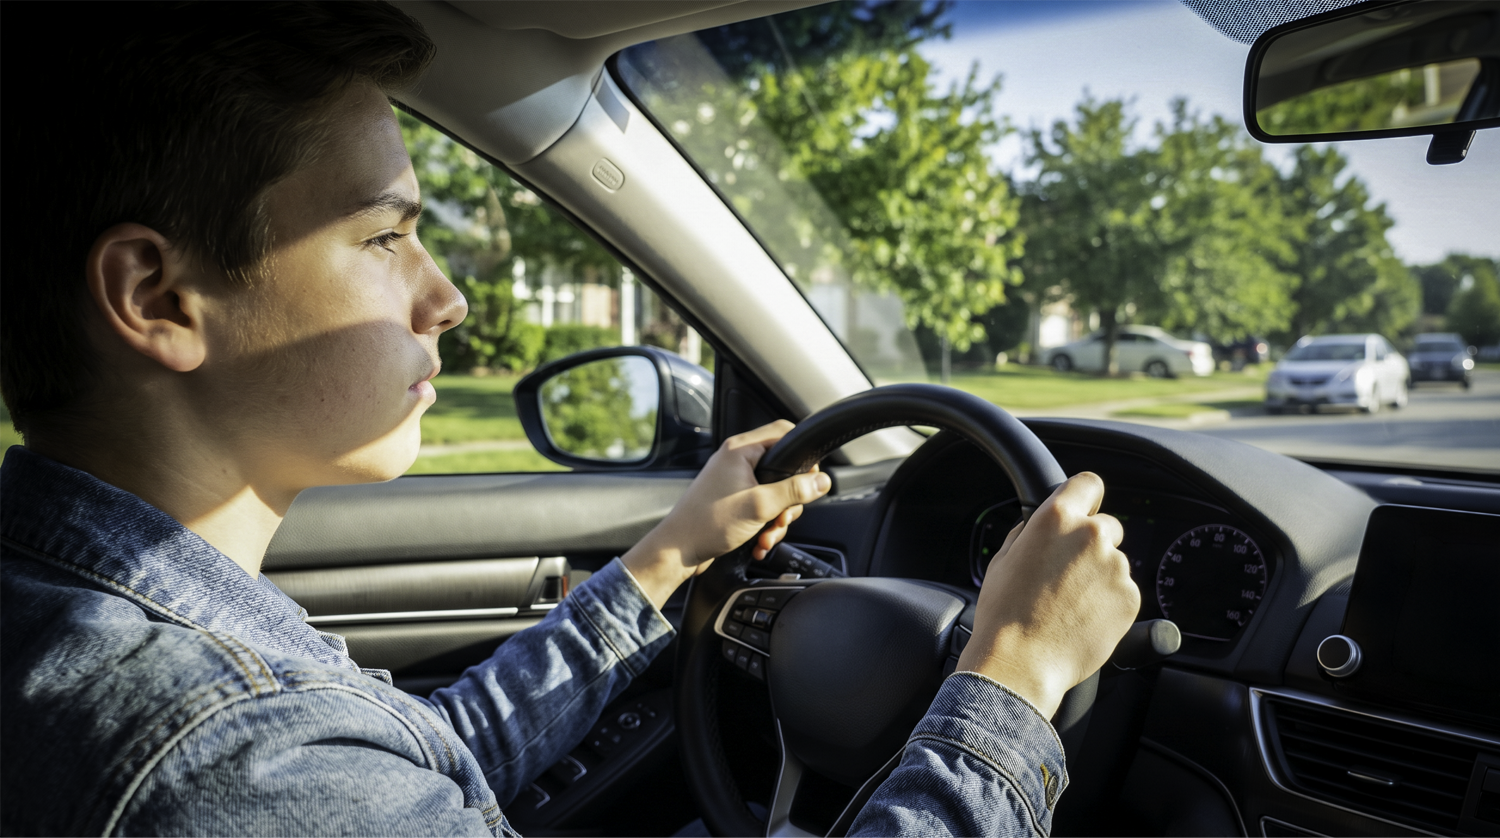
Let’s say you have a teenager and you are worried about their speed as they drive through residential neighborhoods or school zones. Speed Bands can show you how fast they were traveling through specific areas, making it easier to have a conversation about following the posted speed limits in those areas.
Speed Bands are also useful to monitor the driving speeds of any elderly drivers in your life. For example, you notice that they are routinely driving slower than the posted speed limit on a freeway. That could be an indication that the driver feels nervous or anxious in faster, heavier traffic.
Speed Bands Show the Full Context Of Driving Alerts
When driving alerts display on a trip map, they show the location and details of the event, such as the rate of acceleration or deceleration, depending on the alert. With Speed Bands, you get the context behind the alert.

Now you can see the speed of the vehicle before the driving event takes place. Did a rapid acceleration event take place on a freeway or in a residential neighborhood? How fast did the vehicle travel after the acceleration? The additional context ensures you don’t assume bad driving behavior just because a driving event occurred.
Use Speed Bands to Color-Code Your Trip Maps
To set up Speed Bands, select the Settings icon, then choose Speed Bands. The color slider allows you to customize colors for up to six speed ranges you create.

The most successful conversations about driving habits and behavior start with context and quality information. Speed Bands provide both.
See Your Drives in Full Color
Speed Bands add a new layer of context to your trip maps, making it easier than ever to visualize how, where, and when your vehicle is moving. It's just one of the many ways Bouncie helps you drive smarter, safer, and with more confidence.
Have questions? Visit our Support Center for quick answers and helpful resources.